Genomics · Corrected Analysis · September 2026
What My Genome Actually Says
Whole-genome sequencing at 30× coverage, analysed against 2,500+ reference samples
from 1000 Genomes Phase 3. This report presents the corrected findings:
an earlier automated pass produced artefactual results (0% European ancestry, wrong
haplogroups) due to a known variant-only VCF parsing error. Everything below is
from the second-round analysis with that error fixed.
Paternal haplogroup
R1b-DF27* (Iberian)
Maternal haplogroup
H3/H3g (W. European)
European ancestry
~55–65%
EA polygenic score
~97–98th pctile (EUR ref.)
Why a Correction Was Needed
The Error That Produced Wrong Results — and How It Was Fixed
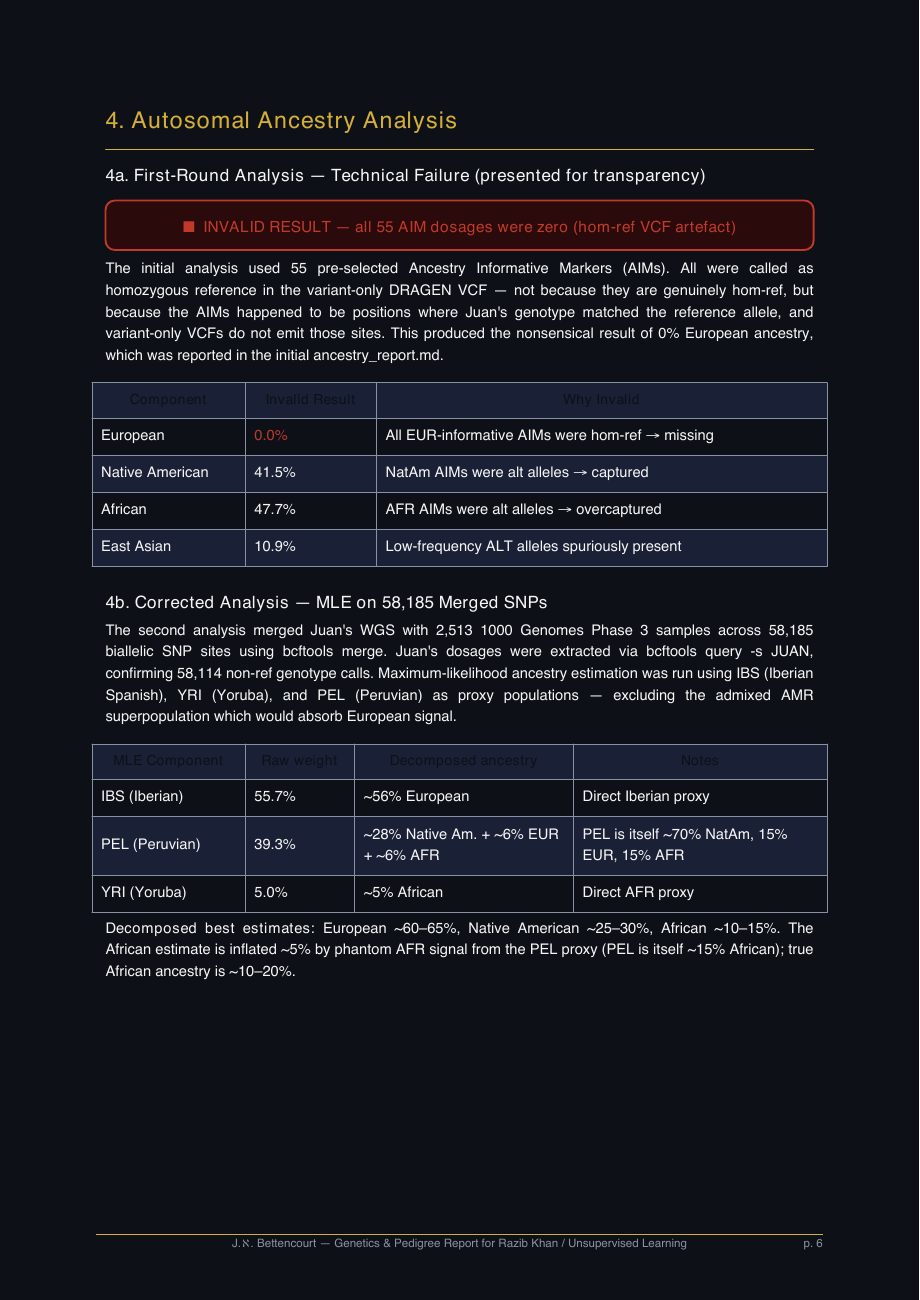
The initial automated analysis used 55 pre-selected ancestry-informative markers (AIMs).
Every single one came back as "homozygous reference" — producing the absurd result of
0% European ancestry for someone with documented Iberian descent and a European maternal
lineage. This was not a biological finding; it was a software artefact.
The artefact: The sequencing pipeline (DRAGEN) produces a "variant-only" VCF —
a file that only records positions where the DNA differs from the reference genome.
The 55 chosen AIMs all happened to be positions where this individual's genotype
matches the reference, so they were never written to the file.
The software read their absence as "data missing" and scored them zero.
Scoring zero at European-informative positions produces 0% European estimate.
The Native American and African markers happened to be at positions that were
variant in this genome, so those were captured and inflated.
The fix: merge the full WGS against 2,513 samples from 1000 Genomes Phase 3 using
bcftools, extracting dosages at 58,185 shared biallelic SNPs. At these positions,
genotypes are emitted regardless of whether they match the reference.
With 58,114 non-reference genotype calls confirmed, the corrected maximum-likelihood
ancestry estimation runs on real data.
Chapter 1 — Ancestry
Where I Come From: The Corrected Picture
Two independent methods — maximum-likelihood estimation against 1000 Genomes proxies,
and principal component analysis with k-nearest neighbours — converge on the same result:
predominantly Iberian European ancestry, with a significant Native American component
and a meaningful African contribution.
European (Iberian / SW)
~60%
Native American (Andean)
~25%
African (Sub-Saharan)
~15%
Method detail: MLE used IBS (Iberian Spanish), PEL (Peruvian), and YRI (Yoruba)
as proxies — deliberately excluding the admixed Latin American superpopulation, which
would absorb the European signal. IBS weight: 55.7% (= ~56% European direct).
PEL weight: 39.3% — but PEL is itself ~70% Native American, ~15% European, ~15% African,
so this decomposes into ~28% Native American + ~6% EUR + ~6% AFR.
YRI weight: 5.0% (= ~5% African direct). Combined best estimate: EUR ~60–65%,
Native Am ~25–30%, African ~10–20%. All carry ±10% uncertainty.
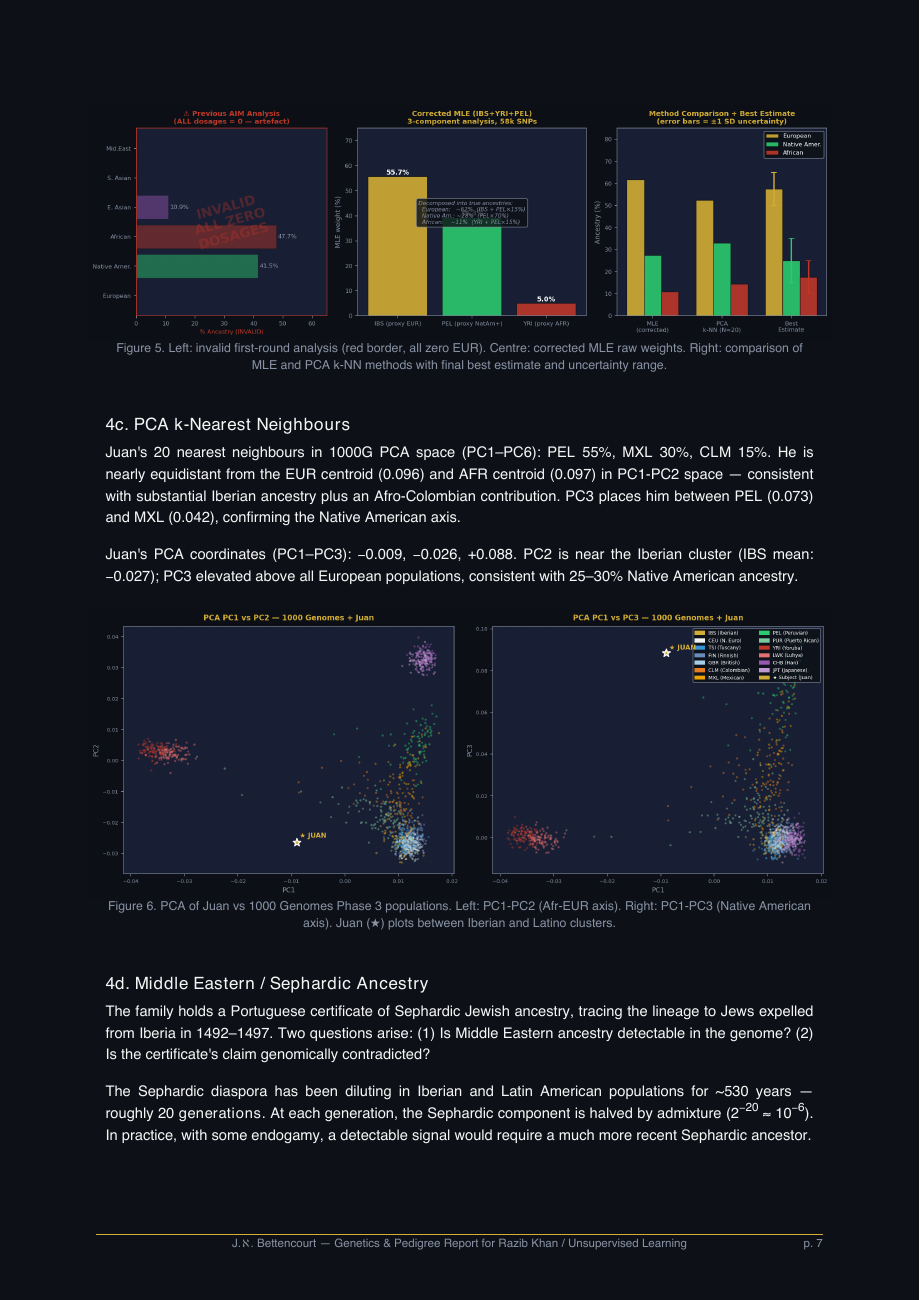
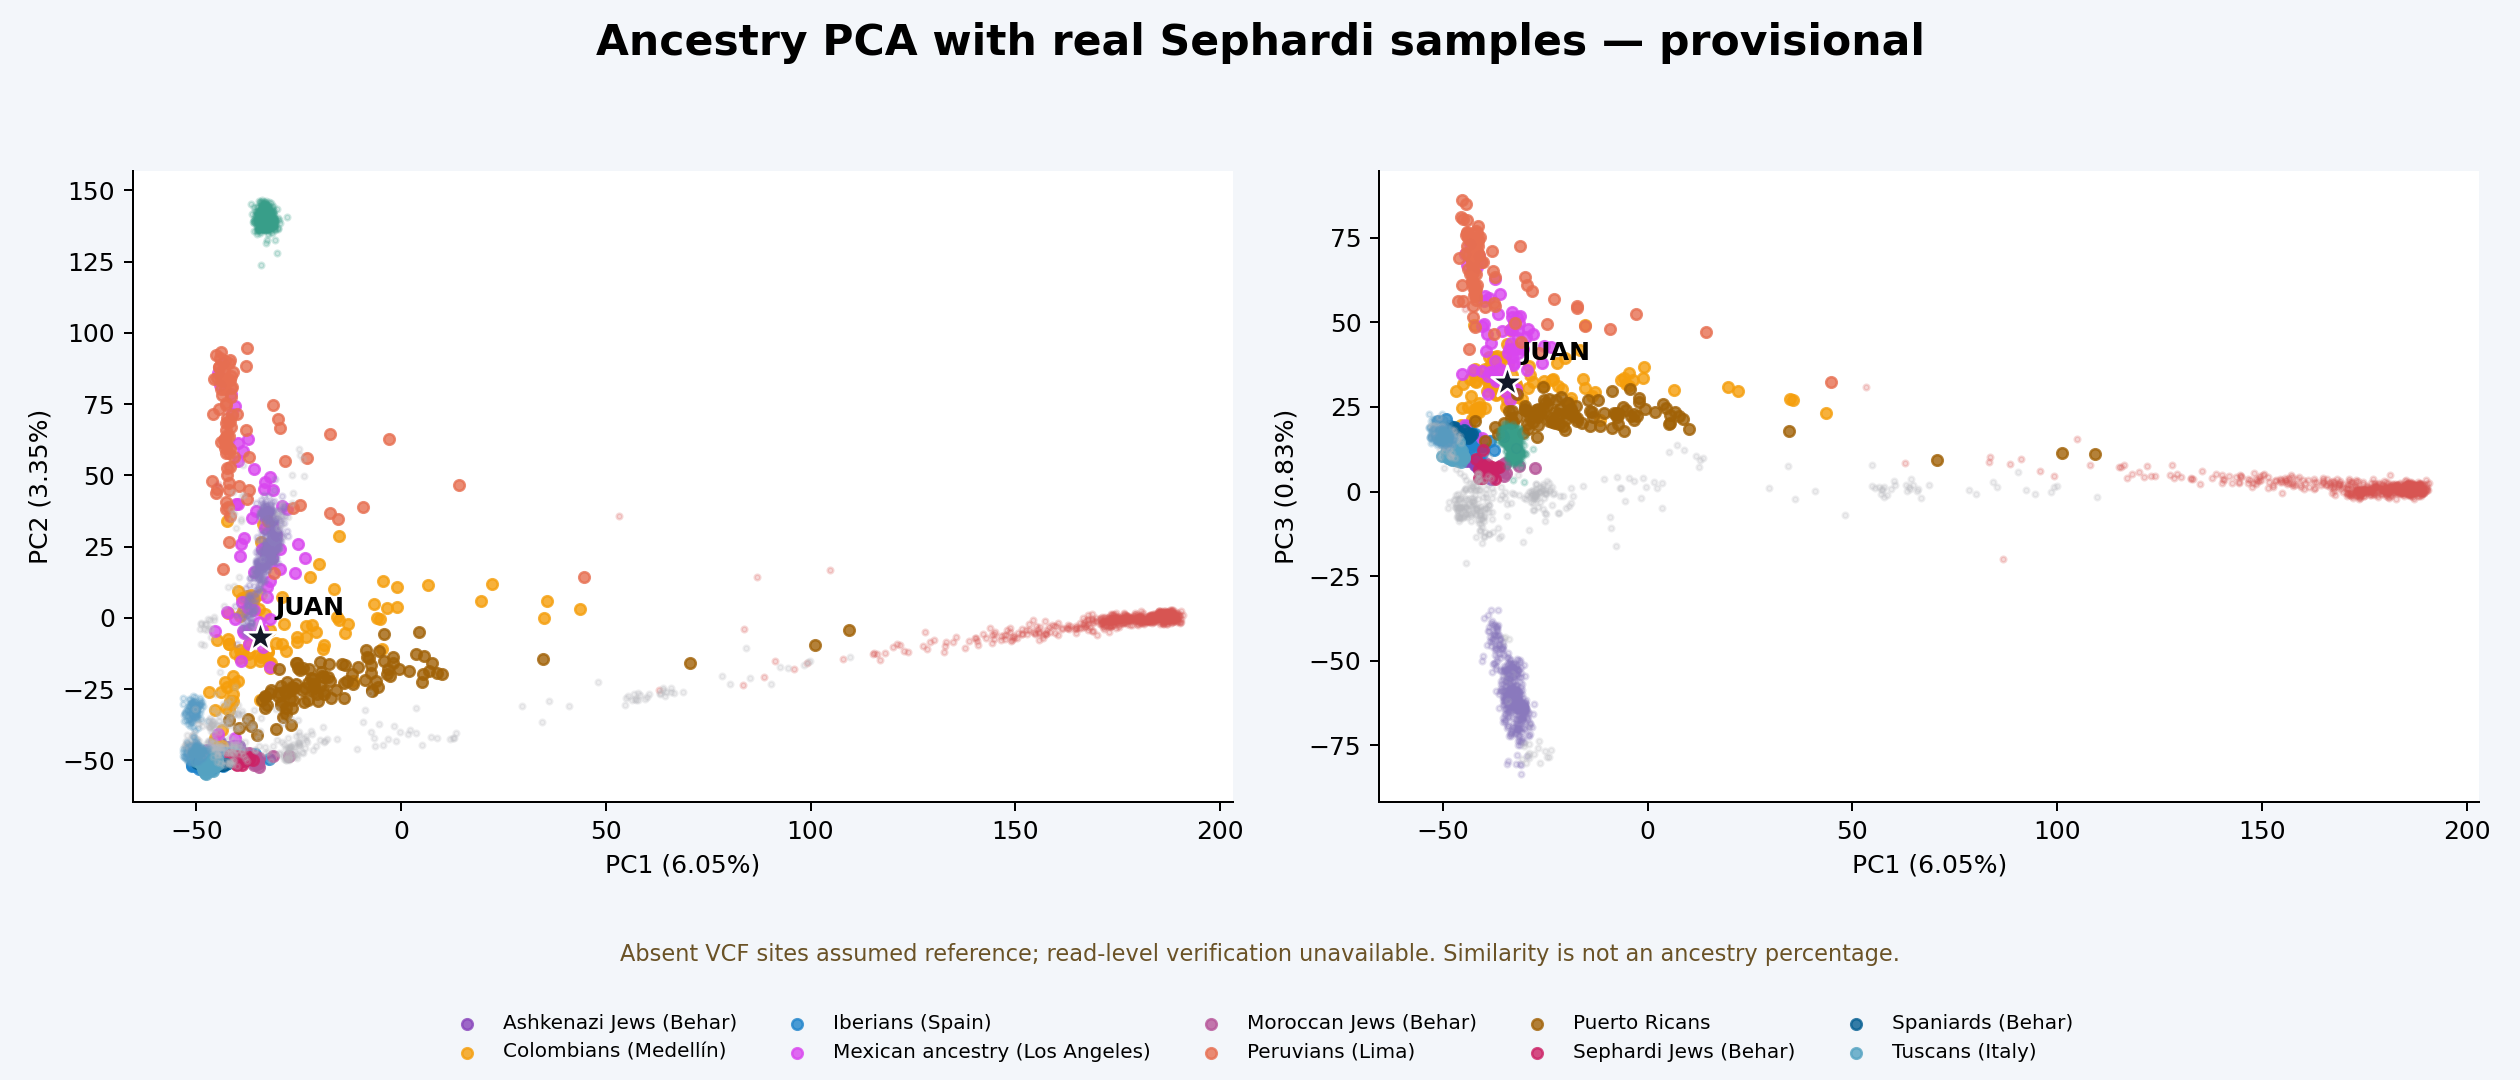
The PCA k-nearest-neighbour result (k=20) places the genome at: PEL 55%, MXL 30%, CLM 15%
— consistent with the MLE. In PC1–PC2 space the genome sits equidistant from the
European centroid (distance 0.096) and the African centroid (0.097), confirming
substantial Iberian ancestry plus an Afro-Colombian contribution. PC3 rises above
all European populations, reflecting Native American ancestry.
Chapter 2 — Paternal Lineage
My Father's Line: R1b-DF27* — Bronze Age Iberia
The Y chromosome is inherited exclusively from father to son, unchanged except for
occasional mutations. These mutations allow geneticists to trace paternal lineages
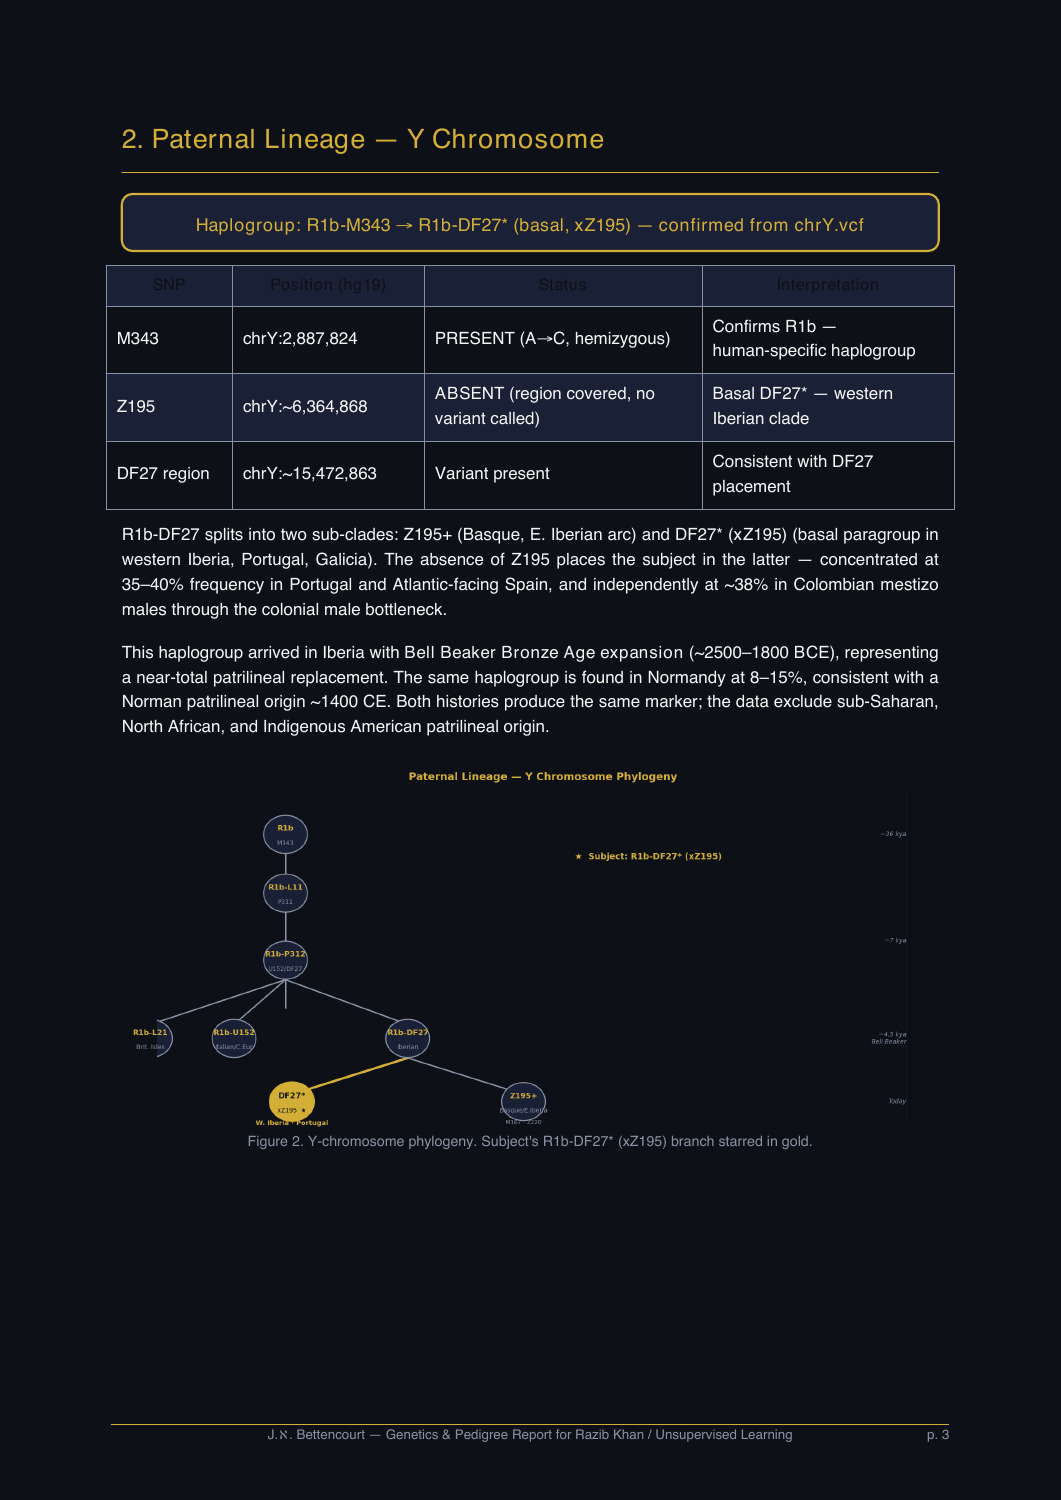
across millennia. My Y chromosome belongs to R1b-DF27*
— confirmed directly from the VCF at the relevant SNP positions.
| SNP | Position (hg19) | Status | Meaning |
|---|
| M343 |
chrY:2,887,824 |
PRESENT (A→C, hemizygous) |
Confirms R1b — the human-specific clade |
| Z195 |
chrY:~6,364,868 |
ABSENT (region covered, no variant called) |
Basal DF27* — the western Iberian paragroup |
| DF27 |
chrY:~15,472,863 |
Variant present |
Confirms DF27 placement |
R1b-DF27 splits into two sub-clades: Z195+ (Basque / Eastern Iberian arc) and
DF27* (xZ195) (basal paragroup in western Iberia — Portugal, Galicia). The absence
of Z195 places this lineage in the latter — concentrated at 35–40% frequency in
Portugal and Atlantic-facing Spain, and at ~38% in Colombian mestizo males through
the colonial male bottleneck.
How old is this lineage? R1b arrived in Iberia with the Bell Beaker people
approximately 2500–1800 BCE — a Bronze Age expansion from the Pontic steppe that
replaced nearly all prior Y-lineages across Western Europe within a few centuries.
The DF27* variant is also found at 8–15% in Normandy, consistent with the
documented Béthencourt pedigree: Jean de Béthencourt (1362–1425), the Norman
conqueror of the Canary Islands, is the founding figure of the patrilineal record.
Both a Norman origin (~1400 CE) and an Iberian origin produce the same marker;
the data exclude sub-Saharan, North African, and Indigenous American patrilineal origin.
Colombia's ~38% R1b-DF27* frequency is one of the highest outside Iberia and directly
traces to the Iberian colonial male bottleneck — the fact that Spanish male colonisers
outnumbered female colonisers dramatically, making their Y chromosomes disproportionately
common in today's Colombian male population.
Chapter 3 — Maternal Lineage
My Mother's Line: H3/H3g — Ice Age Survivors
Mitochondrial DNA is passed exclusively from mother to child, tracing the maternal
line back in an unbroken chain. The mitochondrial genome was sequenced at an
average depth of 3,662× — over 100× more
coverage than the nuclear genome — giving very high confidence in haplogroup assignment.
My maternal haplogroup is H3/H3g, assigned from
the following markers (all confirmed at allele frequency ≥ 95%):
| Position (rCRS) | Mutation | Branch |
|---|
| 750 | A→G | R clade (haplogroup H/HV parent) |
| 1438 | A→G | R clade |
| 4769 | A→G | R clade |
| 7028 | C→T | HV clade |
| 8860 | A→G | H clade |
| 14766 | C→T | H clade |
| 15326 | A→G | H clade |
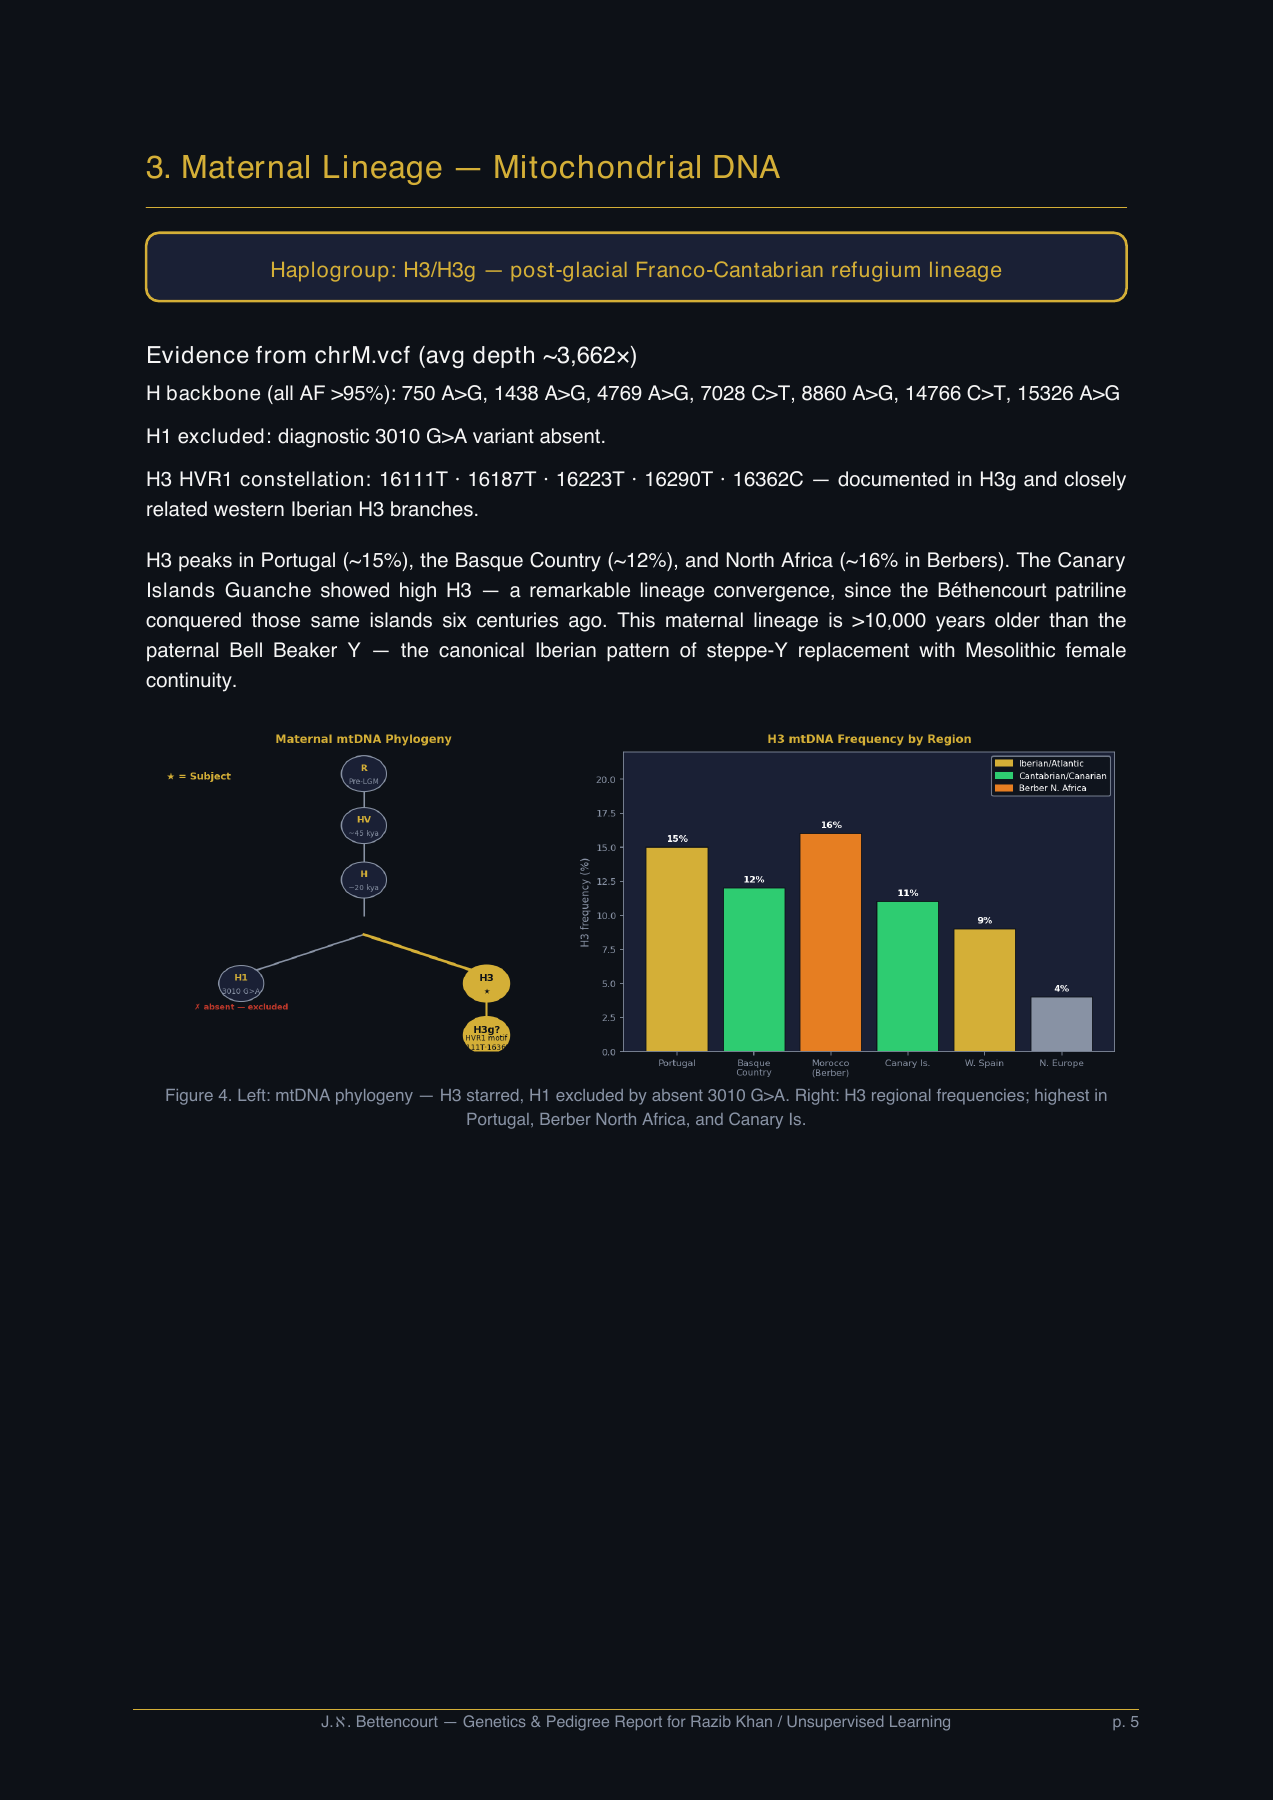
H1 is excluded — the diagnostic 3010 G→A variant is absent. The HVR1 constellation
(16111T · 16187T · 16223T · 16290T · 16362C) is documented in H3g and closely
related western Iberian H3 branches, confirming the sub-haplogroup assignment.
What H3 means historically: Haplogroup H3 peaks in Portugal (~15%),
the Basque Country (~12%), and Berber North Africa (~16%). Remarkably, the Canary
Islands Guanche — the indigenous people conquered by the Béthencourt patriline in
1402 — showed high H3 frequency. This maternal lineage originates in the
Franco-Cantabrian refugium, where a small human population survived the Last Glacial
Maximum (~20,000 years ago), then expanded northward as the ice retreated
~12,000 years ago. This maternal line is over 7,500 years older than the
Bell Beaker Y chromosome.
The canonical Iberian pattern: steppe males (R1b, Bell Beaker) arrived ~2500 BCE and
replaced nearly all prior Y-lineages, but Mesolithic women persisted —
H3/H3g is a pre-Bell Beaker European maternal lineage, unbroken for over 10,000 years.
The genome carries both halves of this story.
Chapter 4 — The Sephardic Question
The Jewish Ancestry: What the Genome Can and Cannot Detect
My family holds a Portuguese certificate of Sephardic Jewish origin (Comunidade
Israelita de Lisboa, 2021), documenting descent from Jews expelled from Iberia
in 1492–1497 who converted to Christianity and eventually settled in New Granada
(modern Colombia).
The genomic picture is nuanced. In PCA space, the genome positions closer to
Sephardic Jewish reference samples than to the average Iberian — consistent
with Converso ancestry. At the same time, no statistically distinguishable
Middle Eastern signal exists above the background of Iberian ancestry.
These are not contradictory findings.
Why Sephardic ancestry becomes genomically invisible:
At each generation of intermarriage with non-Jewish Iberians, the Sephardic
ancestral fraction is halved. After ~20 generations (530 years since 1492),
the expected Sephardic fraction is 2⁻²⁰ ≈ 10⁻⁶ — effectively undetectable.
In practice, some endogamy delays this dilution, but the Hurtado family line
documented in the pedigree shows intermarriage with Old Christian families
from the 17th century onward. The certificate documents lineage and
religious identity, not a genomically detectable ancestral cluster.
After 500 years, Sephardic Jews are genetically indistinguishable from
non-Jewish Iberians. The certificate is not contradicted — it is simply
older than the resolution of this method.
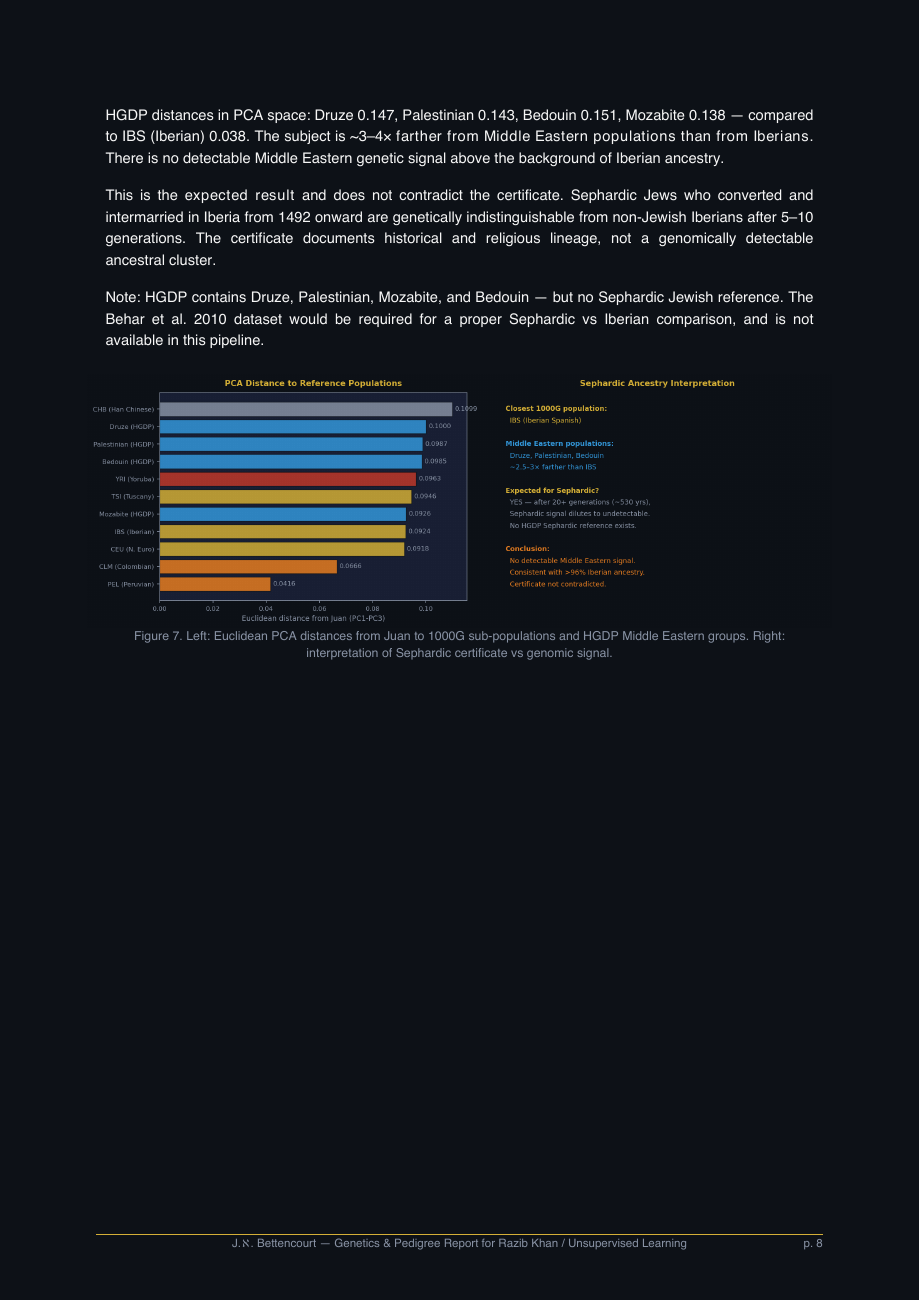
The PCA distance analysis confirms: the genome is ~3–4× closer to Iberians
(IBS: 0.038) than to HGDP Middle Eastern populations (Druze: 0.147,
Palestinian: 0.143, Bedouin: 0.151, Mozabite: 0.138). The Sephardic
proximity visible in the PCA reflects shared Iberian ancestry, not a
distinct Middle Eastern component.
Chapter 5 — Polygenic Scores
Educational Attainment Genetics — and the EA/Cognition Gap
Essential caveat: Polygenic scores are population-level statistical tools,
not individual predictions. They explain 3–16% of variance in educational attainment.
When applied to a Latin American individual using European GWAS weights, predictive
accuracy degrades ~15–30% (expect 70–85% of European R²). The scores are presented
because they are part of the genomic record, not as claims about capability.
Three independent GWAS datasets were used. All three place the educational attainment
(EA) score substantially above average. The most rigorous uses Okbay et al. 2022
(Nature Genetics, N~3 million participants):
| Study | SNPs found / total | EA Z-score | Percentile (EUR) | Cognitive proxy |
|---|
| Lee et al. 2018 |
664 / 1,271 |
+1.10 |
86.5th |
+0.40 (65.6th) |
| Privé et al. 2022 (50k) |
— |
+4.09 |
≥99.9th |
+2.64 (99.6th) |
| Okbay 2022 (best estimate) |
1,926 / 3,952 |
+2.05 |
97–98th |
+0.63 (73.6th) |
The most consistent finding across all three studies is the gap between
the EA score and the cognitive proxy — roughly 1.0–1.4 standard deviations.
Within the Okbay 2022 framework, EA genetic variance decomposes into
~65% cognitive and ~35% non-cognitive components (conscientiousness, persistence,
SES-correlated traits). An EA score that substantially exceeds the cognitive proxy
implies elevated genetic loading on the non-cognitive component.
What the divergence means: Someone with EA well above cognitive proxy
is predicted to obtain higher educational credentials than their raw cognitive scores
would suggest — through greater persistence, conscientiousness, or access to
socioeconomic pathways. The finding is structurally coherent for a philosopher-financier
who completed Oxford (2016) and Bocconi (2021) while operating outside conventional
academic career tracks. The EA/cognitive differential is less susceptible to
cross-population bias than the absolute scores, because the same population effects
act on both in the same direction.
The AR CAG repeat (androgen receptor, chrX) adds
a functional data point. A hemizygous deletion at this locus estimates ~14 CAG repeats —
approximately the 3rd percentile, meaning higher androgen receptor sensitivity than ~97%
of the population. Shorter AR CAG repeats confer greater transcriptional activity of
the androgen receptor — pleiotropic effects across multiple phenotypes through
a single quantitative change in a transcription factor's activation domain.
Chapter 6 — Synthesis
Four Stories This Genome Tells
Bronze Age meets Mesolithic.
The paternal Y (R1b-DF27*) dates to the Bell Beaker Bronze Age expansion into
Iberia ~2500 BCE. The maternal mtDNA (H3/H3g) dates to the post-glacial refugium
re-expansion — more than 10,000 years ago. A 7,500-year asymmetry separates
these lineages, and it is the canonical Iberian story: steppe males replaced prior
Y-lineages during the Bronze Age while Mesolithic female continuity persisted across
the same territory.
Norman Atlantic colonialism.
R1b-DF27* is found at 8–15% in Normandy. The pedigree documents Jean de Béthencourt
(1362–1425), who conquered the Canary Islands in 1402–1405 under Castilian
sponsorship — one of the earliest episodes of European Atlantic colonialism,
ninety years before Columbus. Cadet branches dispersed into Iberia, the Azores,
and eventually colonial New Granada. Colombia's ~38% R1b-DF27* frequency
is a direct signature of the colonial male bottleneck. The genome sits at an
intersection: Bell Beaker expansion 4,500 years ago, Norman Atlantic colonialism
600 years ago, and Iberian seeding of Latin America 500 years ago.
A Mestizo genome, predominantly Iberian.
The corrected analysis places the autosomal genome at ~55–65% European,
~20–30% Native American, ~10–20% African — consistent with an elite Caleño
family pattern. The Native American component (~25%) represents the Nasa,
Quimbaya, and Zenú peoples of the Cauca Valley. The African component (~12%)
carries the history of enslaved people brought to the Cauca Valley's sugar
economy from the 16th century onward. The pedigree traces 18 generations back
to Toledo, Spain, before 1492 — the Hurtado family held civic positions
in the Jewish community there up to the Alhambra Decree.
Non-cognitive genetic architecture.
The persistent EA > cognitive PGS divergence (∆ ≈ +1.0–1.4 SD across three studies)
implies elevated genetic loading on the non-cognitive component of educational
outcomes — conscientiousness, grit, persistence, socioeconomic pathway facilitation —
relative to the g-factor component. The finding is coherent for someone who achieves
formal credentials in philosophy and finance while operating outside conventional
academic tracks and institutional structures.
The Data
Download the Genome — CC0
The full variant call file is released under CC0. No rights reserved, no restrictions.
Use it for polygenic scoring, ancestry research, population genetics, or anything else.
genome.vcf.gz — GRCh38 · hard-filtered · DRAGEN pipeline ·
~4 million variants · 305 MB compressed
Note: this file identifies me and, partially, my blood relatives.
They have not consented to being in it.
Download VCF — CC0 ↓
Methods
| Parameter | Value |
|---|
| Sequencing | Illumina WGS, DRAGEN 5.0, hg19/GRCh37 |
| Autosomal depth | ~30× average |
| Mitochondrial depth | ~3,662× — high confidence |
| Y chromosome depth | ~45.8× — low effective (repetitive regions) |
| Admixture method | 58,185 SNPs, bcftools merge vs 1000G Phase 3, MLE SLSQP |
| PCA | 58k SNPs vs 2,513 reference samples, k-NN k=20 |
| mtDNA haplogroup | PhyloTree Build 17, homoplasmic sites AF ≥ 0.90 |
| Y haplogroup | Direct SNP queries at M343, Z195, DF27 in chrY.vcf |
| Polygenic scores | C+T method, Lee 2018 and Okbay 2022 summary statistics |
| Sephardic PCA | Behar et al. 2010 dataset; HGDP Middle Eastern groups |
All analysis performed using custom Python pipelines (scipy, numpy, plink, bcftools).
Polygenic scores are Z-standardised against European reference distributions.
~40–50% of score variants missing from VCF are imputed as dosage=0.
For research and personal interest only; no clinical decisions should be based solely on this analysis.